In this day and age, it’s of utmost importance to have your website operating correctly on mobile devices. It’s so important that this mentality started the “mobile-first” approach to building websites in which sites are designed for mobile in mind and then “grown” to fit larger screens, as opposed to “shrinking” content down to a mobile format.
To make sure that things are appearing correctly on mobile there are a few tools that will emulate a mobile experience on a desktop (my favorite being Google Chrome’s Developer tools), but sometimes you just need to check things on your own mobile. When something isn’t displaying correctly you’ll need to inspect the HTML on your mobile device to get a better sense of what’s wrong, but you can’t do that directly from your mobile browser. That’s where this guide comes in.
Debug mobile sites remotely from your computer
To set this up, we’ll be using my favorite website debugging tool: Google Chrome’s Developer tools. We’ll be pairing it with an Android device in this example so if you haven’t done so already you’ll have to enable Developer Options on your mobile. When you complete that make sure you leave USB Debugging enabled.
Once the USB Debugging is set up on your phone, connect it to your computer via USB cable and wait for your computer to recognize the device and install the appropriate drivers. Once that’s ready, open up Google Chrome on your desktop and navigate to chrome://inspect. Make sure that the “Discover USB devices” option is checked.
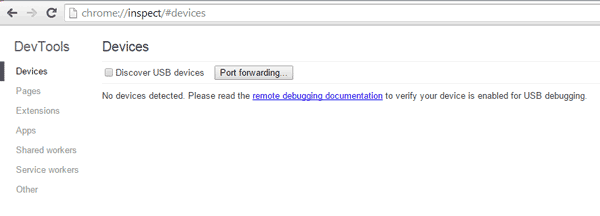
The chrome://inspect developer options on the desktop version of Google Chrome.
You may see an alert on your mobile device asking you to enable remote debugging. Tap OK.
You will now be able to see the open tabs on your device’s browsers as shown in the image below.
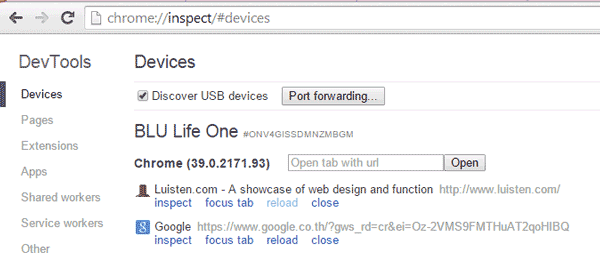
Google Chrome’s Devices Tab showing a connected device with loaded tabs.
From this menu you’ll be able to select which tab you want to inspect and a new window showing only Chrome’s Developer tools will show up with the HTML code for the site loaded on your mobile device. As you hover over lines of code, you will see the highlighted elements in real time on your Android device.
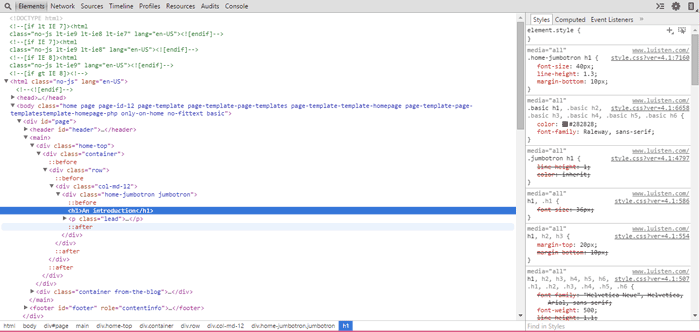
New window showing the HTML code of the mobile page.

The mobile page showing the mouseover element highlighted from the desktop window.
This feature is an absolute essential when it comes to debugging mobile sites as certain elements will be rendered slightly different on mobile screens (especially when working with embedded media). There are more advanced techniques that you can use in combination with these steps such as screencasting and port forwarding. For a more complete look and troubleshooting check out the official Chrome article.